Navigate to Target > Site Map because this is where we will identify a few of the useful features here. Mostly we use the filter options, or at least I do, to cut down on what I like to call "noise". Really all that means is sometimes the amount of data can be overwhelming and I am only looking for specific things. Why not filter for those items?
Open the filter options by clicking here:
Now out of all the sites listed in the site map tab we only need two. We will focus on http://twitter.com and https://twitter.com (http/s is important disctinction to remember when testing a site). One thing I remind folks of is to always add both the HTTP and HTTPS versions of the target application in the the Target > Scope just in case the site requests resources such as image files over HTTP (therefore potentially negating the reason for using SSL if session/cookie values are sent in that request).
Easy way to add them at the Target > Site Map tab is like so:
Okay now that these are added to our scope, lets use the filter option to view only those two applications and cut down on the "noise":
Open the filter again. You will see four columns
1) 'filter by request type'
2) 'filter by MIME type'
3) 'filter by status code'
4) 'folders'
Under the first collumn check 'show only in-scope items'. This will allow you to view only the two applications we've just added to target scope:
Afterwards, you will notice a more focused site map:
The next option under this same collumn is 'show only requested items'. This is shows pages requested either by the spider or you via browser (or if you have a other programs going requesting thru Burp say....screen scraping script/nikto/wikto/etc.). No need for a demo here. Simple.
Show only 'parameterised requests' is pretty cool. If you've gone about the business of submitting every form (or even if you haven't and spider has crawled pages with parameterized queries) its great to show these points of input so you can logically step thru them and keep track of your attack! The results render a gear to the left symbolizing them as parameterized queries. I've highlighted the gears:
Most of this stuff is self explanatory but just remember what I said about an HTTPS site requesting a resource such as images while including an important session value over HTTP. This means you actually have to show the images. So click on that option under 'filter by MIME type':
Navigate to the Proxy > History tab. The filter options are pretty much the same really. However, what I'd like to show is in the actual history itself. So I've chosen NOT to 'show only in-scope items' to show a distinction:
Often times when testing I ask, okay, so when was the last time my cookie was set or where was it first set. The 'cookies' section I've highlited actually shows which cookies were set by request number and the time. Pretty cool stuff, keeps a lot of re-work down to a minimum when answering session related questions.
I've also highlighted the row we will "double-click" to show the response containing the 'set-cookie'.
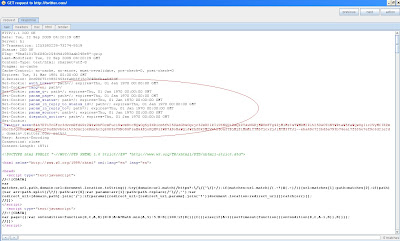
Finally, after we have opened up the request/response which triggered the cookie value, we navigate to the response tab and here the "set-cookie(s)" were highlited:

All of this is fairly basic but nonetheless useful if you are new to Burp Suite.
Happy Hacking!


No comments:
Post a Comment